'A DAY IN THE LIFE OF' ANIMATION

09/01/2017
Written by Frederic Kalinke
TRANSPORT DATA TIME LAPSE
Every year SilverRail powers over 1 billion journey searches for partners around the world. This enables us to capture a wealth of data on travellers’ journey planning queries – showing us when, where and how they intend to travel.
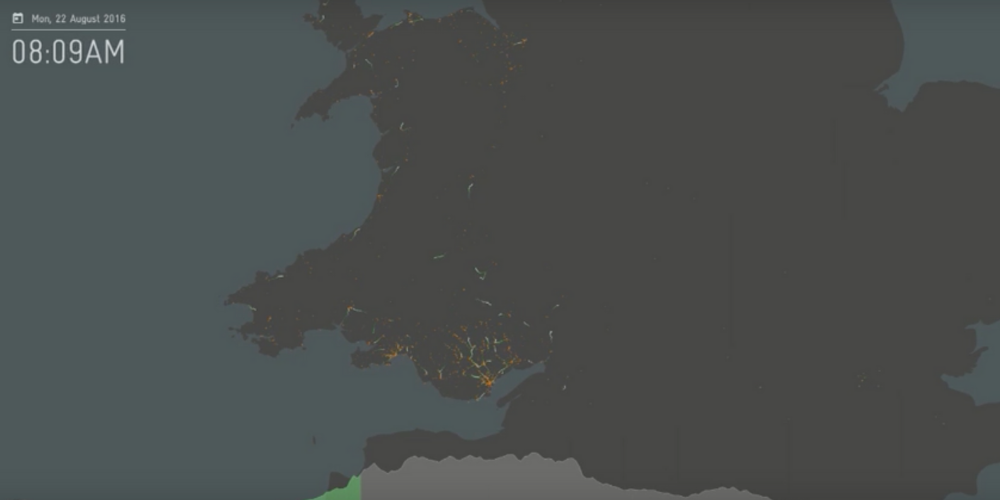
We have collated all of this data to create our latest concept – ‘A Day in the Life of’ animation. Illustrating the use of public transport in two key locations (Wellington, New Zealand and across Wales, UK), over a 24-hour period, it brings ground transportation volume, flow and direction to life.
This type of data is fundamental to transit and city planners
The animation offers a totally new way to represent transport intensity across locations. It can help to deliver data-driven insights to transit and city planners, changing the way they identify bottlenecks, current and future trends in traffic flows and present opportunities for improvements (new routes, increased frequency of services, traffic re-direction and so on). All of this will mean better transportation flow and a better experience for travellers.