THE RAIL BENEFITS CALCULATOR

11/01/2016
Written by Frederic Kalinke
The USA has been getting some bad press recently due to their number two ranking in the ‘2015 trends in global CO2 emissions report’, exposing them as the second largest contributor of global CO2 emissions.
At the 2015 United Nations Climate Change Conference in December, 195 world nations agreed that everything, and anything possible should be done to slow down global warming, with each submitting pledges to begin the process of cutting carbon pollution.
This historic and ground-breaking pledge has placed a huge amount of scrutiny on those participating countries, as well as to the participating companies that are contributing the most to the global carbon footprint.
It’s not all bad news however, and there is help available, showing us that just a few small changes to our daily lives can really make a big difference. One such change is a simple shift in our transport choices. By choosing to take the train rather than fly between key cities, SilverRail customers in the northeast corridor (the mainline between Washington & Boston) have saved 167 tons of CO2 over the last 12 months. That’s equivalent to the lifetime CO2 absorption of 46 trees.
But could we do more?
The answer is undoubtedly yes! Having engaged with businesses around the world, we have found that organisations in Europe generally consider and report on environmental factors more frequently than their counterparts in the USA, which is likely influenced by local regulations and requirements.
SilverRail Technologies has developed a Rail Benefits Calculator, for use in any market and on any route, to help corporate buyers and travel managers quickly determine the impact of taking the train instead of flying, when it is a viable alternative, on their travel programs. KPIs included in the benefits dashboard include:
- Monetary savings
- CO2 savings
- Productivity
- Journey time
Your Personalised Rail Benefit Calculator
The benefits are displayed on an interactive dashboard, as shown below, allowing users to control the market share component which in turn alters the results and clearly pinpoints which travel routes present the highest benefits of travel via train over air, or shows the benefits if the usage of rail is increased.
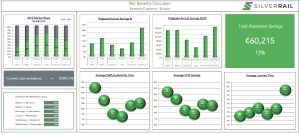
Using data specific to the corporation ensures that the results are relevant, and presents travel managers with the key statistics and information needed to assist them in putting together a business case in order to obtain buy-in for change from stakeholders within their organisations.
Your dashboard broken down
In the following example we have chosen six of the most popular EU city-to-city travel routes, and input example market share figures for each route for rail and air travel for a typical company.
Rail vs Air Marketshare
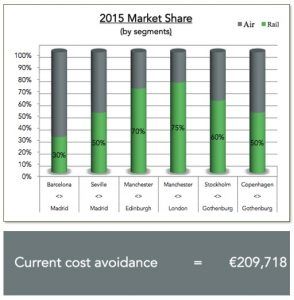
This chart shows the current usage of rail vs air per route, to determine the market share for each. Below that, it shows the total cost avoidance the company has achieved from their current levels of rail vs air usage. A clear KPI to present to any business leader on what the company has already saved by choosing rail over air.
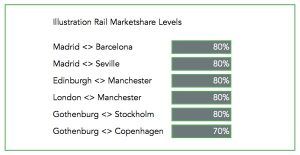
Could we do more?
As stated before the answer is undoubtedly yes – and this part of the dashboard enables you to determine just how much. By increasing the market share numbers on the right, travel mangers can quickly determine how increasing their travel by rail on certain routes will affect key business KPIs.
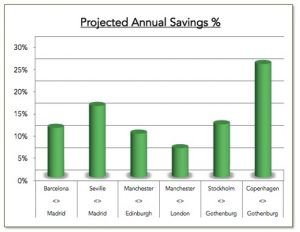
Annual Savings %
Based on the newly inputted market share, this figure shows the percentage of savings that could be achieved per route.
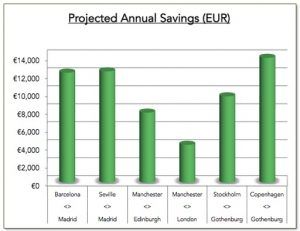
Annual Savings (£)
This shows the actual savings number, which is useful if you have specific savings targets to meet, and can be used to quickly highlight which city-to-city route would make the largest impact to the company’s bottom line if they were to increase their rail travel.
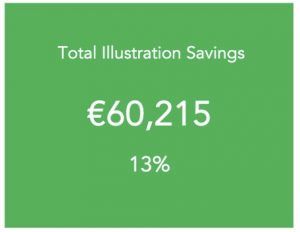
Total Savings
This helps to quickly highlight what the total savings would be if all six travel routes for the inputted market share levels were adopted.
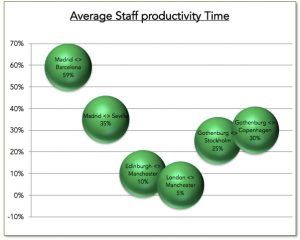
Staff Productivity
This chart compares how productive travelers are when travelling by rail, compared with air. Although air may sometimes be quicker than rail, when you take into account the time taken to check-in, pass security and lack of connectivity when flying, an individual’s productivity levels are often much lower than if they travelled by train.
In the above example, the Madrid to Barcelona route shows a 59% uplift in overall productivity for travellers if 80% of them traveled by rail. The beauty of this tool is that if a company decides productivity is a key requirement for business, it is clear to see that levels can be increased further by increasing the percentage of rail travelers from 80% – 90%.
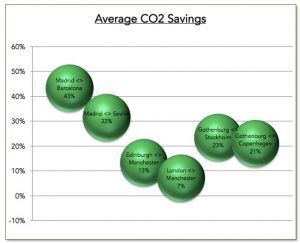
CO2 Savings
This chart shows that on the Madrid to Barcelona route this company would save 43% more CO2 if 80% of their travelers were to travel via rail instead of air. As climate change becomes more and more of a priority and with higher and more frequent tax implications, this metric is becoming a key consideration for businesses.
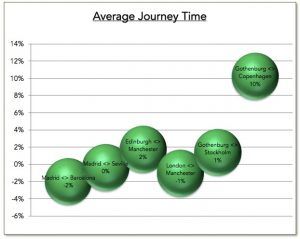
Journey Time
This chart shows what impact rail travel would have on a travellers journey time when compared with air. In this example it shows that Madrid to Barcelona by rail is quicker than by air, a key benefit to present not only to the company decision makers but more importantly to the travelers to encourage early adoption. It can sometimes show that rail is a slower alternative e.g. Gothenburg to Copenhagen, and so Travel Managers can use the tools to test the viability of certain routes to make sure it works for their business.
They may in the end decide that the 12% longer journey time is outweighed by other benefits.
Overall the calculator is a great way to really determine what will and will not work for your company based on your own priorities and objectives, as well as giving you all the ammunition you need to get your business case for rail travel approved.
So what are you waiting for?
Make a difference. Not just to your company, but to the very world we live and breathe in.